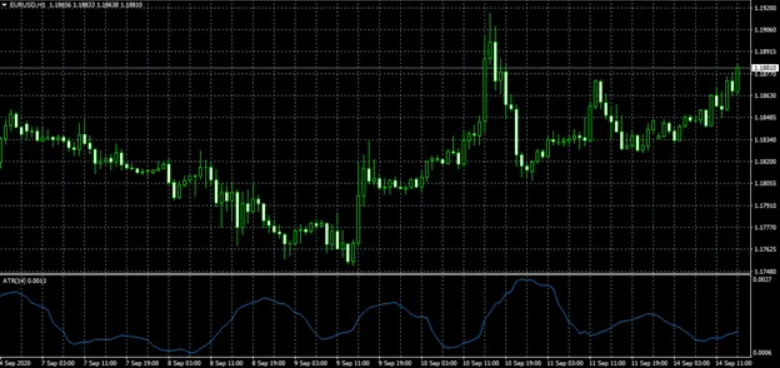
Traders widely use the ATR indicator to measure market volatility. It is considered one of the most popular and universally accepted technical indicators in the trading community. Within this article, we shall elucidate the reasoning behind it, the manner in which it is computed, and how you can incorporate the ATR indicator into your trading strategy.
What is the ATR Indicator?
Created by J. Welles Wilder and first presented in his work ‘New Concepts in Technical Trading Systems’, ATR is a volatility oscillator that plots its results as a line on a price chart. Due to the large number of historical price bars, it is often smoothed over fourteen periods. This indicator can be used to roughly estimate an asset’s price volatility over a certain time period.
Initially created for commodities trading, the ATR has gained popularity in various other markets, including forex. The indicator does not provide a clear indication of the trend’s direction; instead, it simply assesses the level of volatility present in the market.
How Does the ATR Work?
The ATR indicator operates by calculating the True Range (TR) for the present bar and a number of preceding bars (typically 13) and subsequently averaging the data to indicate the average movement of a specific instrument.
The value of the ‘True Range’ for a bar or candle is initially determined as the most excellent absolute value of:
- Subtracting the current low price from the current high price
- Difference between the current high and the previous close
- The distinction between the current low and the previous close
The last two are utilized in situations where the preceding closing price fell outside the current range, precisely the previous day, in order to accommodate for gaps, particularly in stocks and future assets. The maximum absolute value is selected, irrespective of its sign.
A moving average is then applied to the series of ‘True Ranges’ to create a smoother representation of the data and enhance its significance. This is utilized to identify intervals of swift price fluctuations where the majority of market activity takes place.
What Is the Proper Way to Interpret the ATR Indicator?
Simply put, when the ATR value is higher, it means there is greater volatility for that particular instrument at that moment. Conversely, a lower ATR value suggests less volatility.
A fresh outcome is computed for every fresh interval, so, for instance, on a 1H chart, it will refresh every hour, and on a 1M chart, it will refresh every minute, and so forth.

The indicator tends to significantly increase at the beginning of the trading session due to the higher level of market volatility during this time. When it comes to stocks, you’ll notice a surge in activity as soon as the market opens each day. This is a clear sign that the daily volatility, as measured by the average true range (ATR), is higher compared to the previous day’s closing.
It is crucial to also take into account the past ATR readings to gain a comprehensive understanding of price movements.
Calculating the ATR
The calculation of the Average True Range (ATR) solely relies on historical price data and is relatively straightforward when compared to other indicators.
Let’s say you’re interested in examining the fluctuation of Gold prices over ten days. To calculate this, start by subtracting the current low from the current high. Then, subtract the previous close from the current high or subtract the last close from the current low (whichever difference is more significant). To obtain the accurate range for ten consecutive daily candles, you should repeat this process. Once the data is smoothly averaged, it will yield the initial 10-day ATR reading.
Using the ATR Indicator in Trading
The ATR is designed explicitly for Futures & Commodities, but it can also be used for forex and other securities.
The suggested time frame is 14. By opting for a more extended period, traders can expect a reduction in the number of trading signals produced. Conversely, a shorter period will increase the quantity of signals.
When it comes to trade entry, ATR can serve as a valuable tool to validate signals provided by other indicators or provide cautionary indications for potential unfavorable market entry points. For instance, if an asset has already experienced a significant deviation from the average, it might not be advisable to initiate a trade with the expectation of an even more substantial movement.
In addition to assessing the potency of a trend and validating entry signals, ATR proves highly valuable in calculating the trade magnitude and stop-loss range and identifying the optimal take-profit level.
ATR can assist in determining the appropriate trade size by indicating the extent to which a specific asset fluctuates. This ensures that you take a huge, manageable position on a highly volatile instrument. Typically, when the Average True Range (ATR) is higher, it suggests a smaller position size, and conversely, when the ATR is lower, it indicates a more prominent position size.
One standard error made by inexperienced traders is placing a stop loss that is too close. Still, by utilizing the Average True Range (ATR), you can establish a stop loss level that takes into consideration the daily fluctuations of the market. When the ATR is high, brace yourself for more extensive price fluctuations.
To prevent getting stopped out too soon, place your stop loss at a greater distance. On the other hand, if the ATR is low, it indicates a narrower price range. In such cases, you can opt for a tighter stop loss level. The same principle can be applied to determining the levels at which to take profits.
Another widespread use is the chandelier exit plan, where a trailing stop is positioned below the highest peak reached since the position was initiated. The gap between the top level and the highest high is calculated using a specific multiple of ATR. For instance, a trader might deduct twice the ATR value from the highest high.
Another option is to apply the identical method as mentioned earlier to establish a Stop Loss at a specific distance from the support or resistance levels.
When it comes to selecting a suitable multiple, there is no definitive answer, as it varies based on your trading preferences. However, opting for a smaller multiple will result in smaller trends and shorter trades, while employing a larger multiple enables you to capture significant trends and prolong your trades. (assuming it aligns with your preferences).
Conclusion
- The Average True Range indicator is highly favored and extensively utilized by traders to assess market volatility.
- Indicating the direction of price does not provide any assistance.
- Can help validate trade entries.
- It can be precious as an exit plan for establishing stop loss/take profit levels or determining position size.
By now, you should have a clearer understanding of how the indicator operates and its potential applications in trading.


